For Kitchen & Bath Companies Doing $1M–$10M/Year

One Shop Per Area.
Every Lead Is Yours.

Illustration of a key over a circular background, symbolizing security or access.
The whole plan for your area: Google + Meta ads, organic search, social content, 60-second follow-up, reviews, email, website.
We run all of it. You answer the phone and build kitchens.From $3,500 a month. One shop per area.


Areas are filling. One shop per area. Once it's gone, it's gone.

90 seconds: how it works

The Problem

The Shared-Lead Trap

Here's how the lead platforms actually work: a homeowner fills out one form about their kitchen. That single form is sold to three, four — sometimes eight — companies at once, including yours. Now everyone is calling the same person. Whoever answers first gets the conversation. Whoever quotes cheapest gets the job. You paid for the lead either way. Contractors report it working out to $1,400 or more per job actually booked.

YOUR LEAD. YOURS ALONE.

FORM

That's not marketing. It's an auction where you bid against your neighbors for a customer none of you own.

The companies winning right now didn't get better at the auction. They left it. They own their area's search results, they respond in minutes instead of hours, and they walk into every estimate pre-sold by their reviews. That's what we install.

The System

What We Install

01

Google + Meta ads, organic search, and social content — all coordinated around your area. Homeowners see you before they've decided who to call. Every channel working together, managed for you.

02

Win the First Five Minutes

Every inquiry answered in under 5 minutes, day or night. Missed calls get a text back in 60 seconds. The first company to respond usually wins the job. That company becomes you.

03

Own the Reputation

5-star review engine, social content that shows your real work, and email to your past customers and open estimates. By the time they call, they already picked you.

Then we report all of it on a monthly scoreboard. Screenshots included.

Plus one text every Friday: calls, estimates, booked.

Exclusivity

One Shop Per Area. We Mean It.

Illustration of a key over a circular background, symbolizing security or access.

When we partner with you, your area closes. We will not take another kitchen & bath company in your service area — not for more money, not for a bigger name. Every lead the system generates is yours alone, and every asset we build — your pages, your campaigns, your tracking — belongs to you.

Why so strict? Because it's the only honest way to do this. An agency running ads for three shops in one city is bidding your budget against itself. The only way we grow in your area is by growing you.

The whole-area lock is a Partner thing. Ads Agent clients get a protected area and first shot at the lock.

Thank you! Your submission has been received!
Oops! Something went wrong while submitting the form.

Results

The Scoreboard

Final Draft Cabinetry — Burnaby, BC

$22.5K

ad spend

Orange arrow pointing diagonally to the upper right on a white background.

$576K

qualified pipeline

"The content creation is amazing — beyond what I had visualized in my mind."

— Fred, Final Draft Cabinetry

≈35% first-year sales lift

Read the full case study →

Monthly Scoreboard — Updated Each Month, Never Retouched
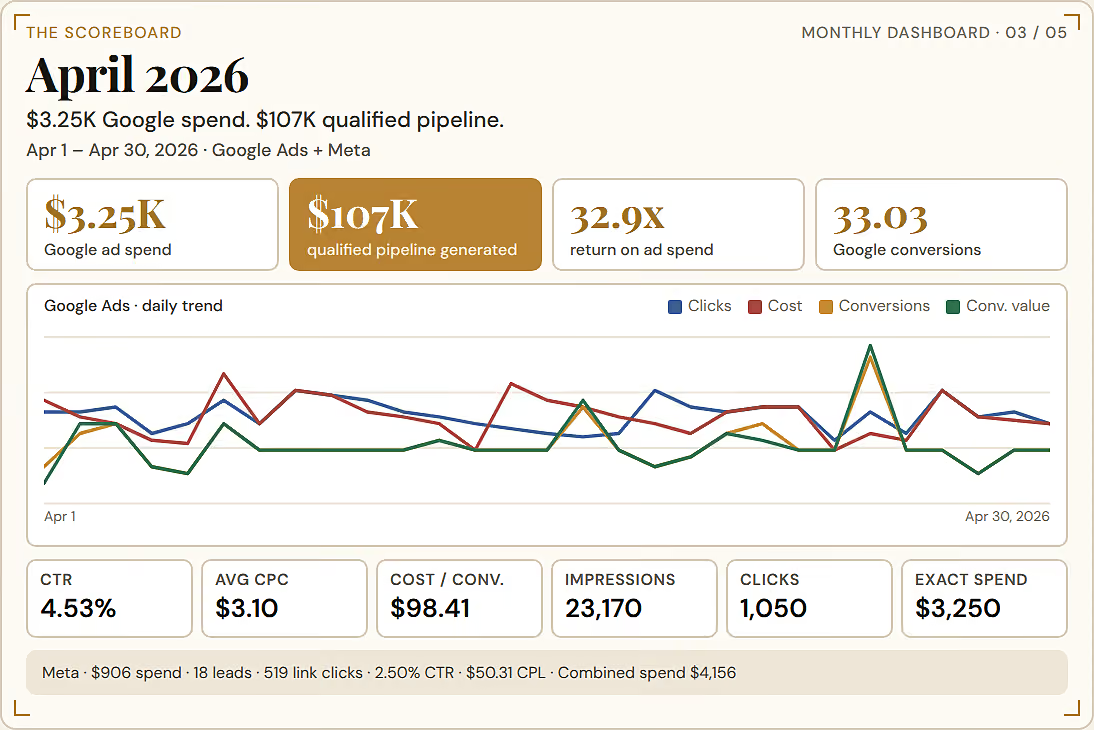
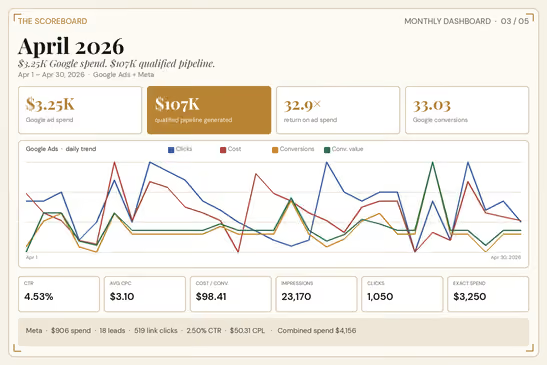
April 2026 monthly scoreboard showing $3.25K Google ad spend, $107K qualified pipeline generated, 32.9X return on ad spend, and 33.03 Google conversions. A line graph shows daily trends from April 1 to April 30 with lines for clicks, cost, conversions, and conversion value. Key metrics include 4.53% CTR, $3.10 average CPC, $98.41 cost per conversion, 23,170 impressions, 1,050 clicks, and exact spend of $3,250. Meta stats show $906 spend, 18 leads, 519 link clicks, 2.50% CTR, $50.31 CPL, and combined spend $4,156.
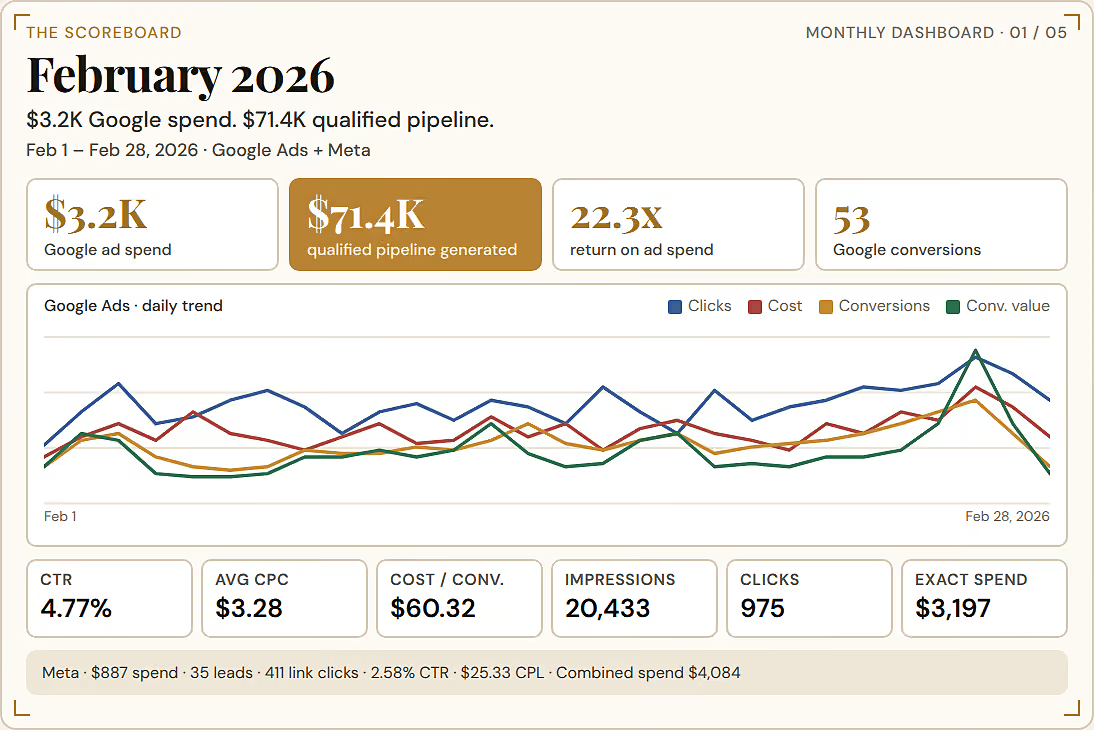
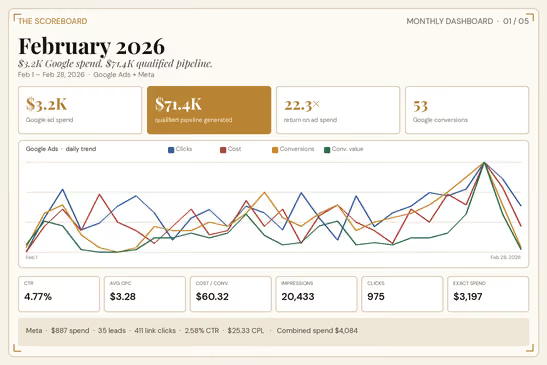
Monthly dashboard for February 2026 shows key Google Ads metrics: $3.2K ad spend, $71.4K qualified pipeline, 22.3x return on ad spend, and 53 Google conversions. A line graph displays daily trends of clicks, cost, conversions, and conversion value throughout February 1 to 28, 2026. Additional stats show CTR at 4.77%, average CPC $3.28, cost per conversion $60.32, 20,433 impressions, 975 clicks, and exact spend $3,197. Meta details report $887 spend, 35 leads, 411 link clicks, 2.58% CTR, $25.33 CPL, and combined spend $4,084.
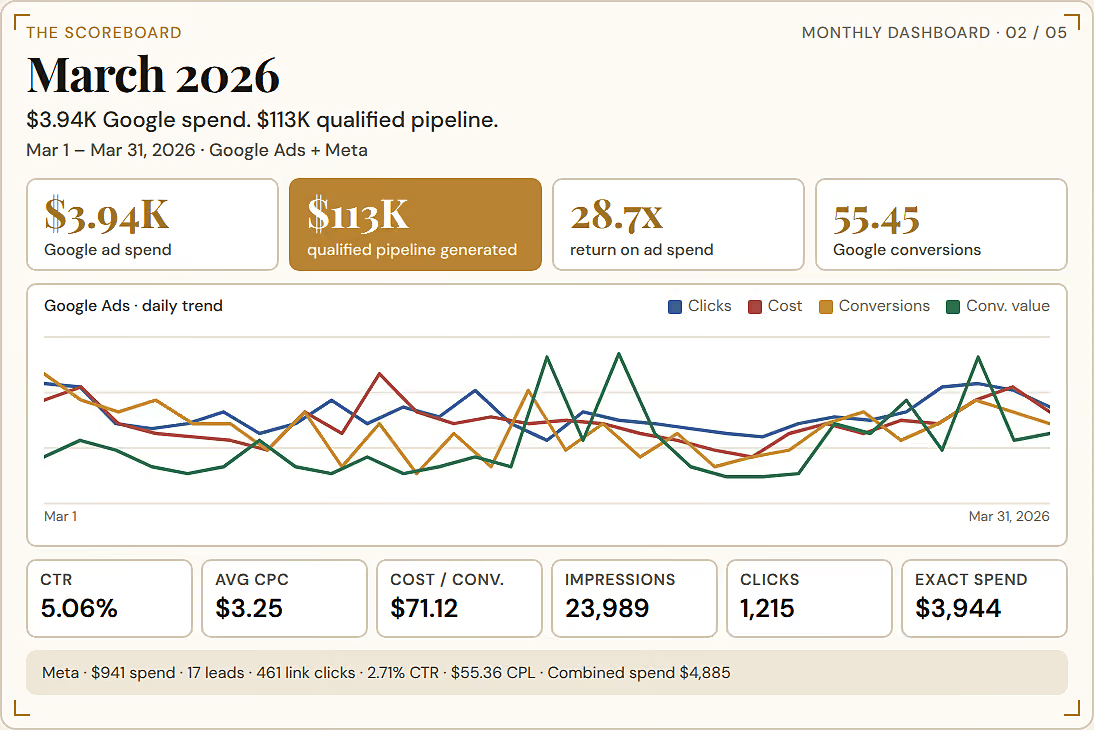
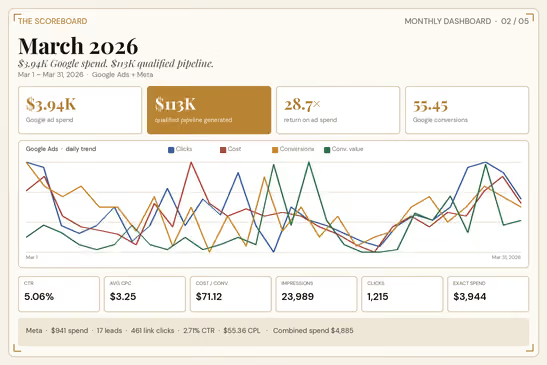
Dashboard for March 2026 showing Google Ads and Meta ad performance from March 1 to March 31, 2026, with $3.94K Google ad spend and $113K qualified pipeline generated. Key metrics include 28.7x return on ad spend, 55.45 Google conversions, 5.06% click-through rate, $3.25 average cost-per-click, $71.12 cost per conversion, 23,989 impressions, 1,215 clicks, and $3,944 exact spend. A line chart shows daily trends of clicks, cost, conversions, and conversion value throughout March. Meta reported $941 spend, 17 leads, 461 link clicks, 2.71% CTR, $55.36 cost per lead, and combined spend of $4,885.
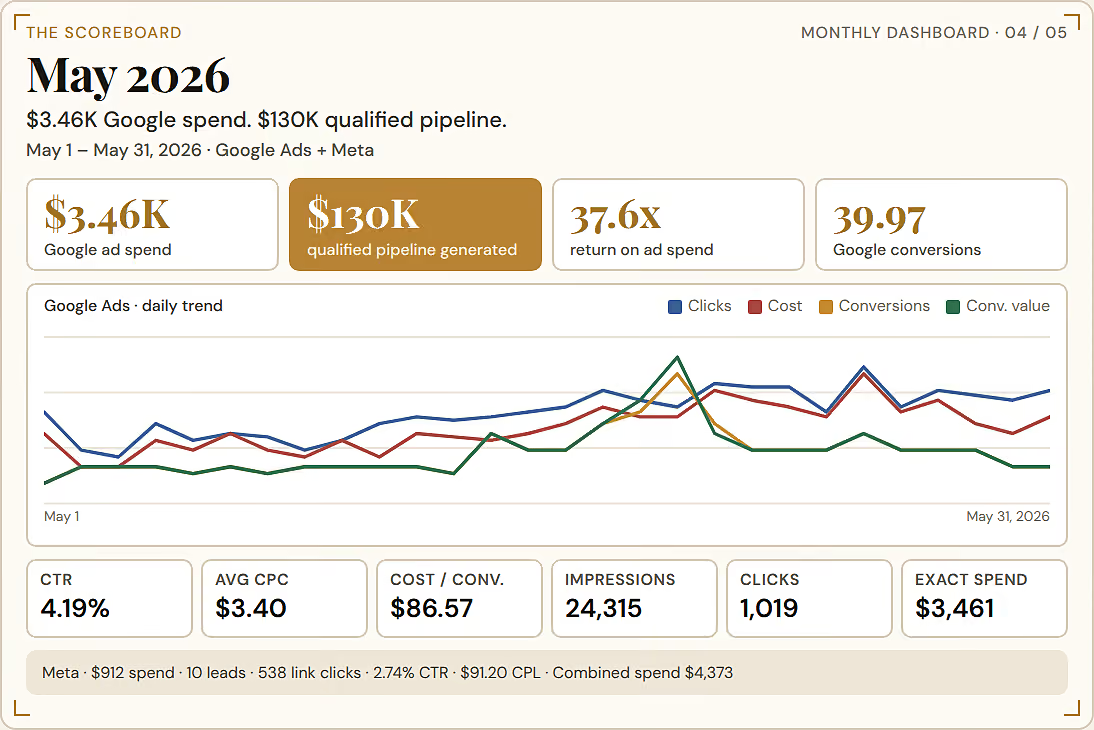
May 2026 monthly dashboard showing Google ad performance with $3.46K spend and $130K qualified pipeline generated. Metrics include 37.6x return on ad spend, 39.97 Google conversions, 4.19% CTR, $3.40 average CPC, $86.57 cost per conversion, 24,315 impressions, 1,019 clicks, and exact spend of $3,461. A daily trend graph plots clicks, cost, conversions, and conversion value from May 1 to May 31. Meta data notes $912 spend, 10 leads, 538 link clicks, 2.74% CTR, $91.20 CPL, and combined spend of $4,373.
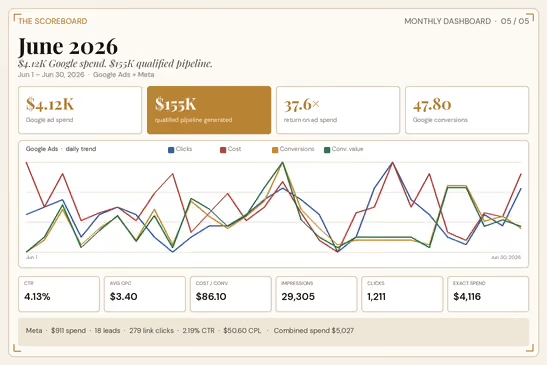
Monthly dashboard scoreboard for June 2026 showing Google ad spend at $4.12K and $155K qualified pipeline generated. Key metrics include 37.6x return on ad spend, 47.8 Google conversions, 4.13% CTR, $3.40 average CPC, $86.10 cost per conversion, 29,305 impressions, 1,211 clicks, and exact spend of $4,116. The Google Ads daily trend line graph plots clicks, cost, conversions, and conversion value over June 1 to June 30, 2026. Meta summary shows $911 spend, 18 leads, 279 link clicks, 2.19% CTR, $50.60 cost per lead, and combined spend of $5,027.
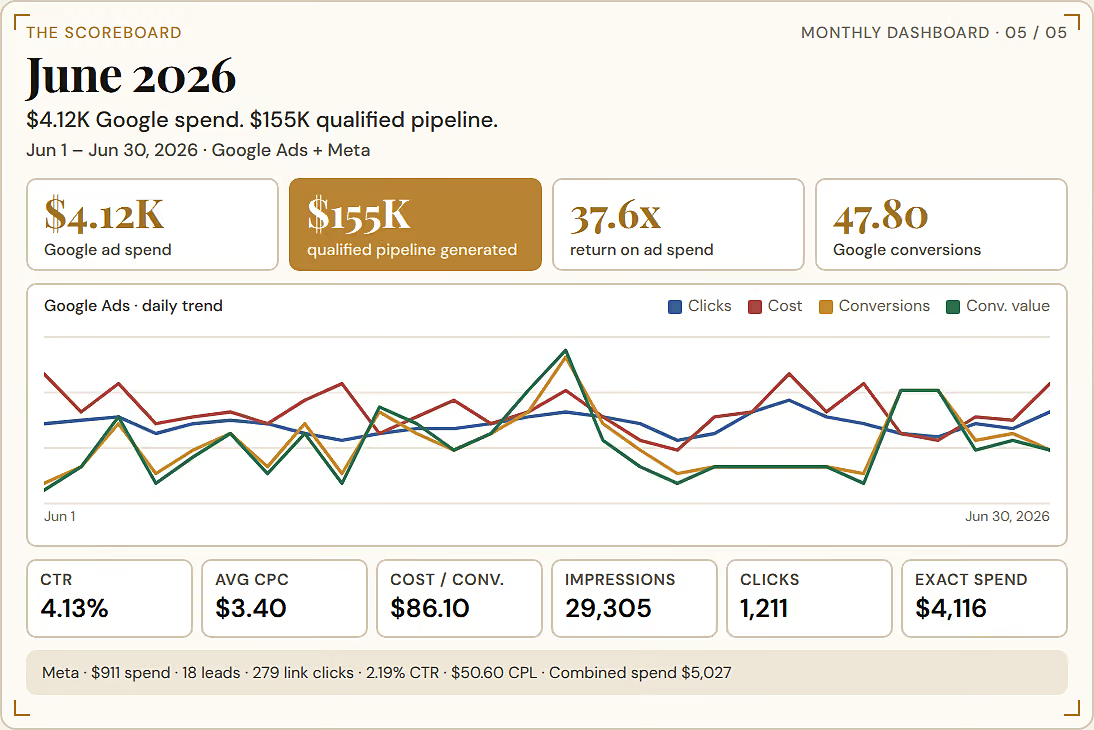
Monthly marketing dashboard for June 2026 showing $4.12K Google ad spend and $155K qualified pipeline generated, with a 37.6x return on ad spend and 47.80 Google conversions. A line graph displays daily trends from June 1 to June 30 for Google Ads clicks, cost, conversions, and conversion value. Below the graph, key metrics include 4.13% CTR, $3.40 average CPC, $86.10 cost per conversion, 29,305 impressions, 1,211 clicks, and $4,116 exact spend. Meta spends $911 generating 18 leads with 279 link clicks, 2.19% CTR, $50.60 CPL, and combined spend $5,027.
April 2026 monthly dashboard showing Google Ads performance: $3.25K Google ad spend, $107K qualified pipeline generated, 32.9x return on ad spend, and 33.03 Google conversions. Line chart displays daily trend from Apr 1 to Apr 30 for clicks (blue), cost (red), conversions (green), and conversion value (yellow). Metrics below chart: CTR 4.53%, average CPC $3.10, cost per conversion $98.41, impressions 23,170, clicks 1,050, exact spend $3,250. Notes mention Meta with $906 spend, 18 leads, 519 link clicks, 2.50% CTR, $50.31 CPL, combined spend $4,156.
Monthly dashboard for February 2026 showing $3.2K Google ad spend and $71.4K qualified pipeline with 22.3x return on ad spend and 53 Google conversions. A line graph displays daily trends for clicks, cost, conversions, and conversion value from Feb 1 to Feb 28, 2026. Key metrics include 4.77% CTR, $3.28 average CPC, $60.32 cost per conversion, 20,433 impressions, 975 clicks, and $3,197 exact spend. Meta summary notes $887 spend, 35 leads, 411 link clicks, 2.58% CTR, $25.33 CPL, and combined spend of $4,084.
Monthly dashboard scoreboard for March 2026 showing $3.94K Google ad spend and $113K qualified pipeline generated with 28.7x return on ad spend and 55.45 Google conversions. Line chart displays daily trends of clicks, cost, conversions, and conversion value from March 1 to 31. Additional metrics below include 5.06% CTR, $3.25 average CPC, $71.12 cost per conversion, 23,989 impressions, 1,215 clicks, and exact spend of $3,944. Meta data notes $941 spend, 17 leads, 461 link clicks, 2.71% CTR, $55.36 CPL, and combined spend of $4,885.

Every Partner gets this. Screenshots monthly. A text every Friday.

What You Get

Everything in the plan.

Top spot on Google with the blue Verified checkmark

A website that books estimates

Your ads run for you. You never log in.

One text every Friday: calls, estimates, booked

Email marketing to your past customers and open estimates

Missed calls texted back in 60 seconds

Monthly scoreboard with screenshots. Never retouched.

5-star review getting, handled

A steady social + content engine — Facebook and Instagram, run for you

No logins. No dashboards. Reports come by text.

Ways to Work Together

Pick your entry point.

Entry

Missed-Call Rescue

$188/mo

You're losing jobs before the conversation starts. Every missed call gets an automatic text back in 60 seconds — keeping the lead warm until you can call back. No setup fee. No contract.

60-second text-back on every missed call

Automatic — works nights and weekends

Branded message in your voice

No setup fee

No contract — cancel anytime

Growth

K&B Ads Agent

$488/mo

We run your Google ads end-to-end — campaign build, copy, targeting, and monthly reporting. Your service area is protected: we won't run ads for a competing shop in your market.

Google + Meta ads built and managed for you

Keyword research + ad copy included

Protected service area

Monthly performance report

Missed-Call Rescue included

First shot at upgrading to Blueprint

See if my area is open

Most partners start here

Regional Growth Partnership

From $3,500/mo + ad spend

Full-stack, done-for-you. Google + Meta ads working together, organic search, follow-up, reviews, website. One kitchen & bath company per area. You answer the phone and close jobs.

Area locked in writing

Google + Meta ads, cross-platform

Organic search + paid, working together

60-second missed-call text-back

Review engine

Monthly scoreboard call

90-day sprints — no lock-in

Flagship

Enterprise & Multi-Location

Custom

For multi-showroom groups, franchises, manufacturers, and dealer networks. One system across every location — co-op eligible, brand-compliant, and built to scale.

Full Growth partners stack at every location

Google + Meta ads, network-wide

Central strategy + local execution

Per-location scorecards + executive rollup

QBRs every quarter

Co-op eligible — brand-compliant

Co-branded content

Competitor lockout per market

Not ready for the whole thing?

Missed-Call Rescue

$188/mo

We catch the calls you're missing. No contract.

K&B Ads Agent

$488/mo

We run your Google ads. Your area protected.

Start small. Move up when the scoreboard says so. Partner clients get first claim on their area either way.

The Honest Comparison

How We Stack Up

KBM Growth Partnership

Shared-lead platforms

Typical agency

Lead exclusivity

Yours alone

Sold to 3–8 competitors

Depends who else they serve

Area protection

One shop per area, in writing

None

Rare

Asset ownership

You do

The platform

Often the agency

Response speed

Under 5 minutes, automated

You're on your own

Not their department

Reporting

Friday text + monthly scoreboard screenshots

Lead counts only

Vanity metrics

Focus

Kitchen & bath only

Every trade

Every industry

Commitment

90-day sprints — renew on results

Billing continues either way

6–12 month lock-ins

Smiling man with brown hair and beard wearing a dark blue suit, white shirt, and dark blue tie against a transparent background.

Eli Brown

Founder, Kitchen Bath Marketing

A Note from Eli

I built Kitchen Bath Marketing in Burnaby, BC, working with kitchen & bath owners who were tired of paying for leads their competitors also received.

The Growth partners is opinionated on purpose: one partner per area, everything measured, screenshots published — and we time our own response speed, because we expect you to time yours.

If your area is open and you're doing $1M–$10M a year, I'd like to talk. If it's taken, I'll tell you straight, and the waitlist is real.

FAQ

Straight Answers

What is the difference between this and the $488 Ads Agent?

Ads Agent runs your Google ads and that is it. The Growth partners is everything: ads, reviews, website, follow-up, plus your area locked so we never work with your competitor. Ads Agent clients get first shot at upgrading.

Why only one shop per area?

We generate leads for you, not a marketplace. If we took your competitor too, we'd be bidding your budget against theirs.

What's included in the partnership?

The full system: Google ads, 60-second follow-up, review engine, website, and a monthly scoreboard call. From $3,500 a month plus your ad spend.

What should I budget for ads?

Most partners put in $2,500 a month on top of the retainer. We'll give you a clear number for your area on the first call.

How fast will I see results?

Leads typically start in the first 30 days and build over 90. You see everything on the scoreboard — we don't hide slow months.

Are we locked into a contract?

No. We work in 90-day sprints and you renew because the numbers say so.

What if my area is already taken?

We'll tell you directly and put you on the waitlist. The $488 Ads Agent is open to anyone.

Can you fix our reviews?

We set up a system that gets happy customers to leave 5-star reviews, and we reply to the bad ones. We don't do anything against platform rules.

No Handcuffs.

We work in 90-day sprints. You see the scoreboard every month and renew because the numbers say so — not because a contract does.

Fred didn't just jump ship — he ran us through 12 consulting sessions first. "Halfway through, I knew I was making the move." — Fred Felty, Final Draft Cabinetry

Check Your Area

Check Your Area.
Takes Ten Seconds.

If it's open, it's yours to claim. If it's not, we'll tell you straight.

Thank you! Your submission has been received!
Oops! Something went wrong while submitting the form.

You'll hear back within one business hour. We time ourselves.